Check Out These Cool Maps I Made!
A map, a map, another map, a dashboard of maps, another dashboard of maps, and a guide to IRA incentives
As the year comes to an end, here’s a post showcasing some of the cool stuff I got to help create in 2023 during my “day job” as a freelance GIS analyst (digital mapmaker) and technical writer!
This isn’t everything I worked on in 2023 (not by a long shot), but it does include most of the complete and public-facing projects.
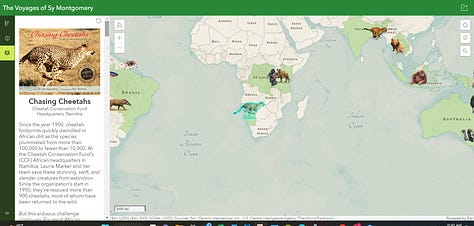
The Voyages of Sy Montgomery
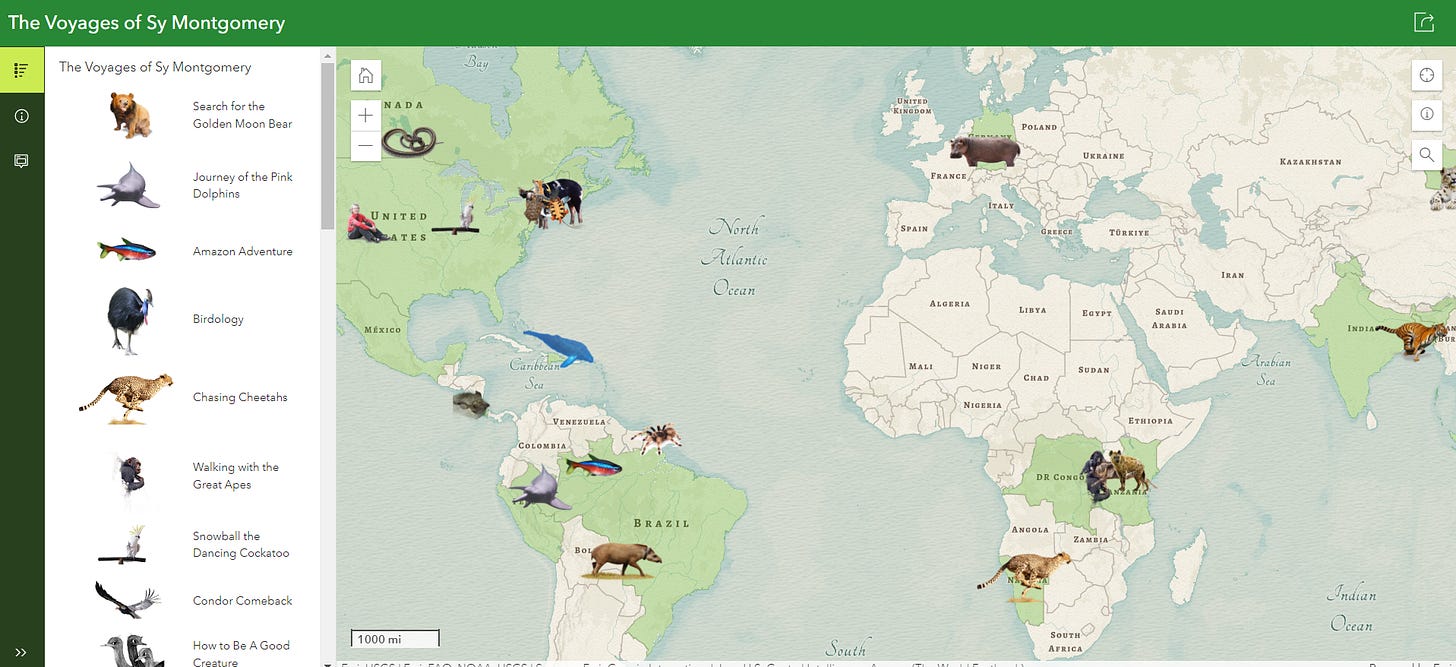
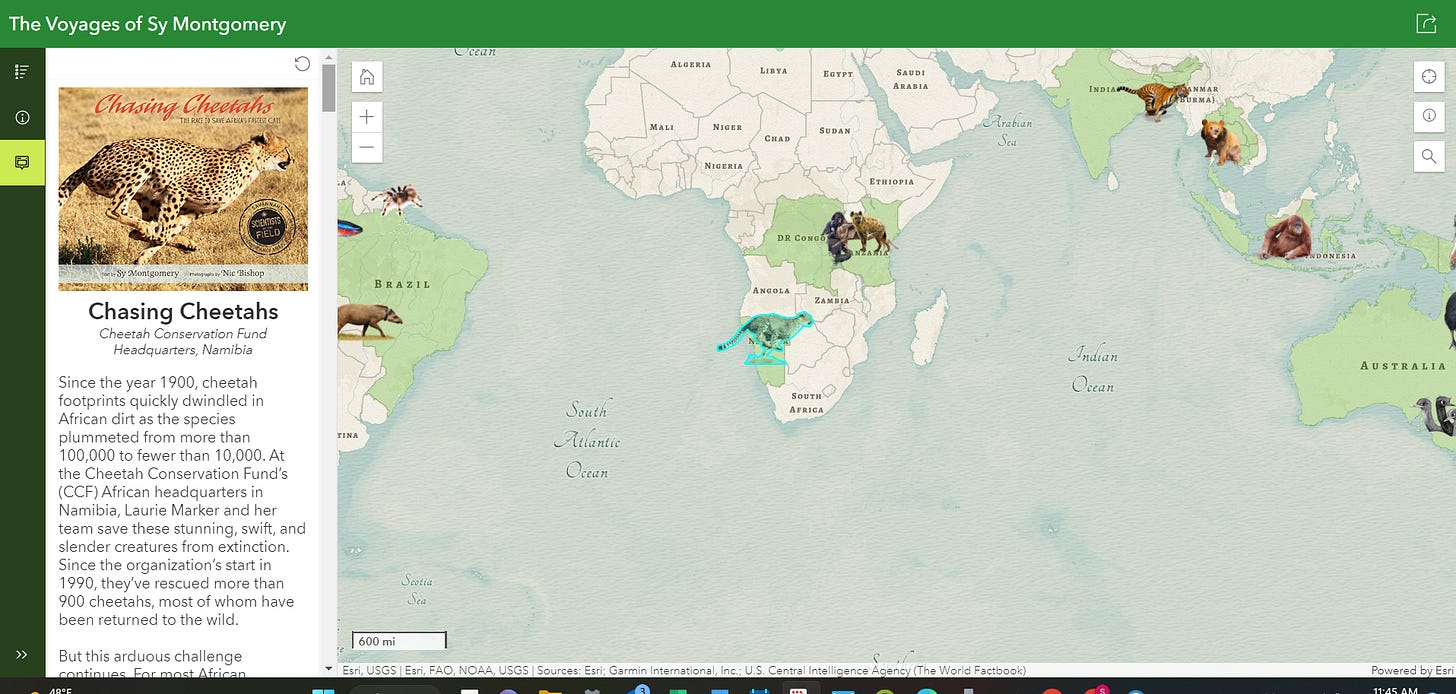
Early in 2023, I had the great pleasure of completing a really awesome commission: a map of the career of one of my childhood heroes, wildlife writer extraordinaire Sy Montgomery! (I also got to interview her for this newsletter).
The map has over 30 custom-made points showing the sites of Sy's travels and writing, with each point clickable to pull up a book summary and/or excerpt. There's also a background layer showing all the countries Sy has visited.
Here’s the page with the map on Sy’s website, and here’s the map itself.
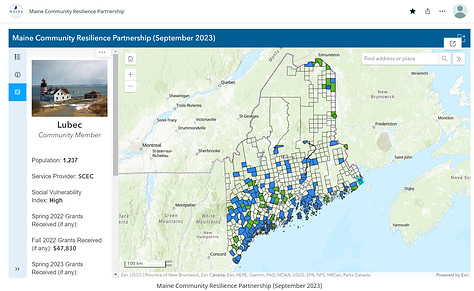
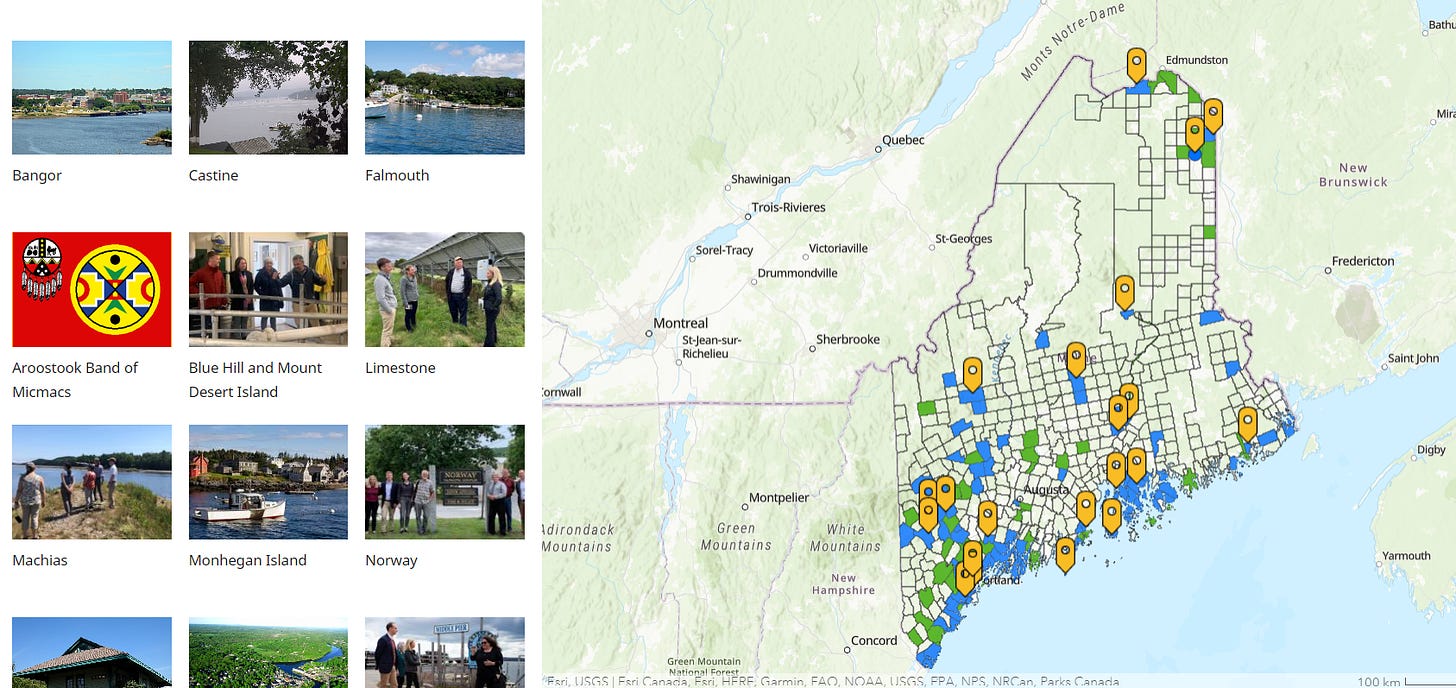
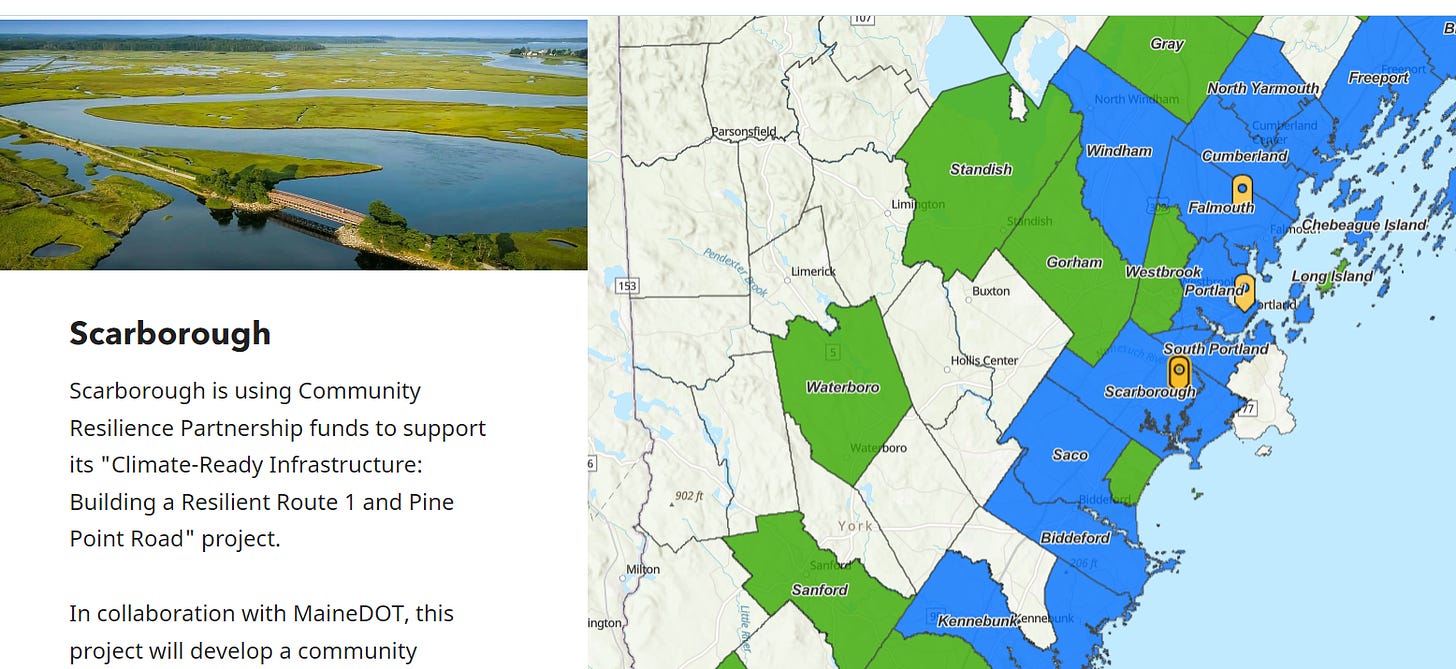
Maine Community Resilience Partnership Story Map
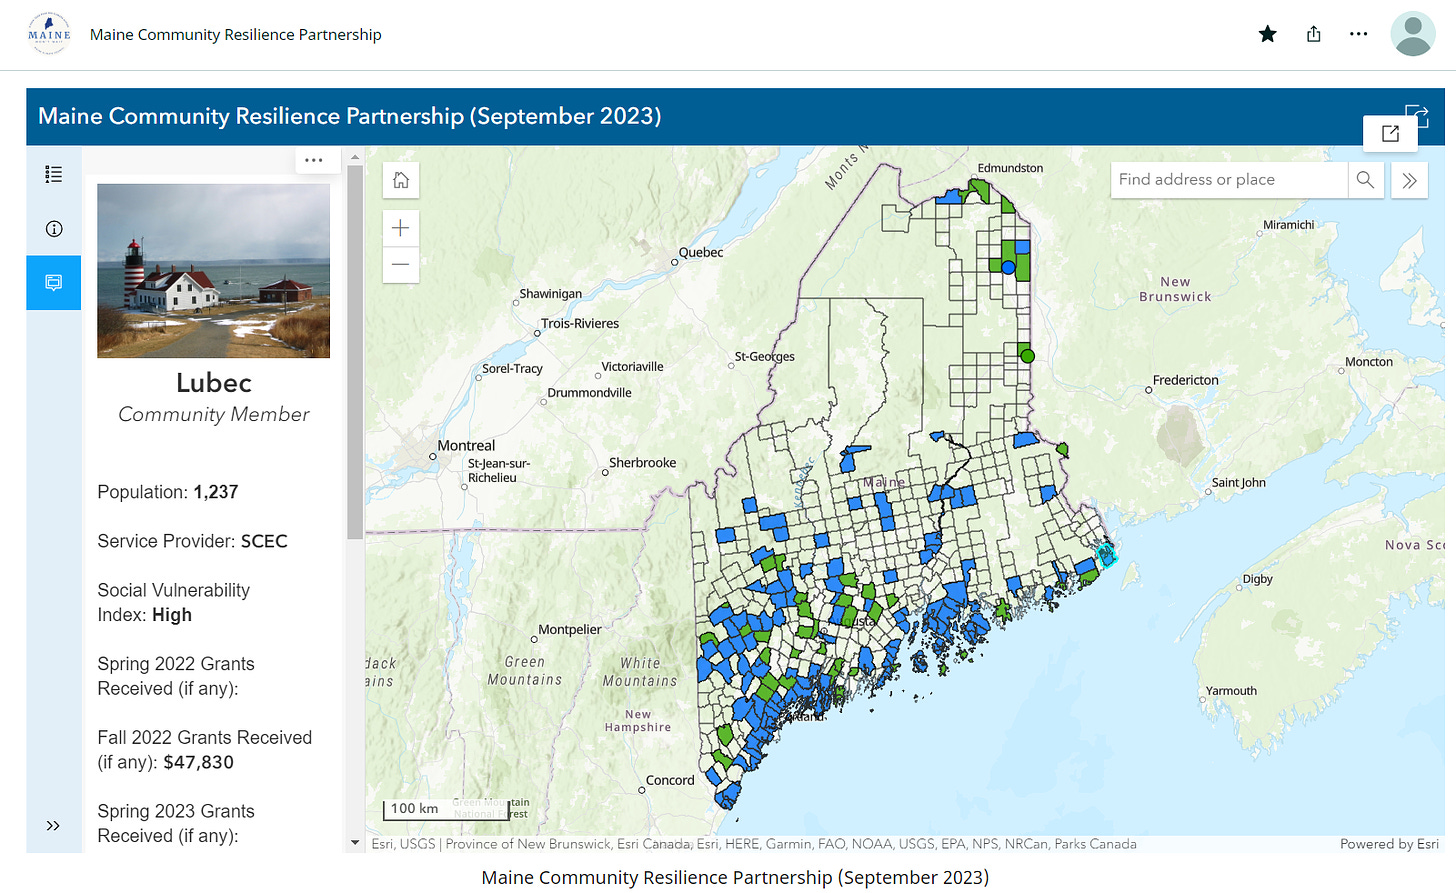
Through grants and direct support to municipal and tribal governments, the Maine Community Resilience Partnership assists communities to reduce carbon emissions, transition to clean energy, and become more resilient to climate change effects such as extreme weather, flooding, rising sea levels, public health impacts, and more.
Since the program was first announced by Governor Mills in December 2021, some 174 cities, towns and Tribal governments in Maine have chosen to participate in the Partnership. Since inception, the program has awarded nearly $6.1 million to 103 communities.
In early 2023, I created a Story Map that showcases the CRP’s awesome work, and updated it with new members and grants in September.
Research & Writing for Mainers' Guide to Climate Incentives
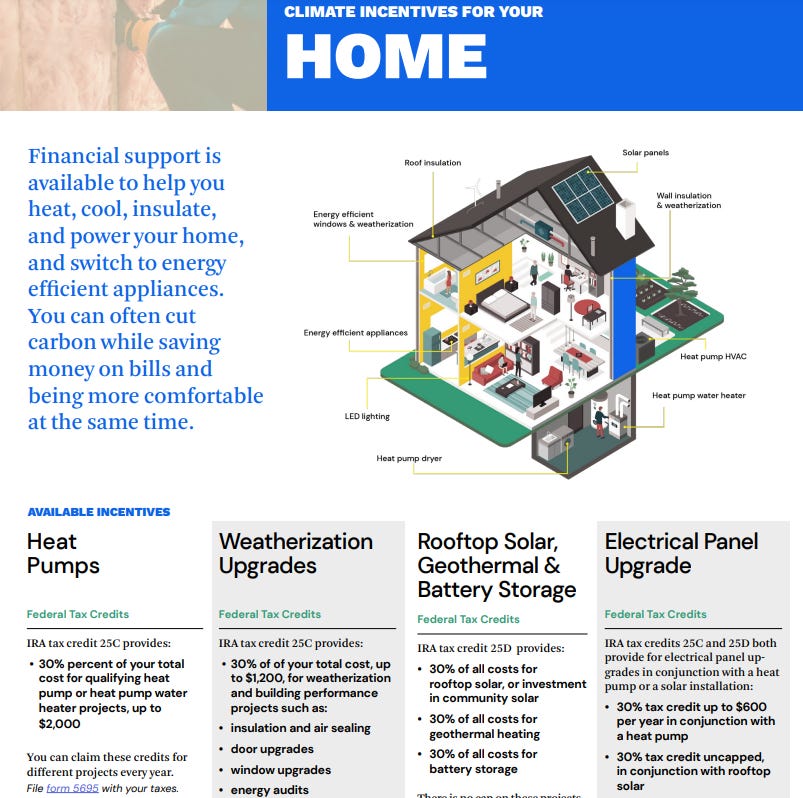
The ever-amazing Inflation Reduction Act created lots of new tax credit incentives for Americans to switch to cleaner vehicles and home appliances, but it can be confusing to navigate. In 2023, the state of Maine published a booklet providing a guide to the IRA benefits available, plus preexisting Efficiency Maine benefits.
I helped research & summarize the IRA tax details in Mainers’ Guide to Climate Incentives. I cannot take credit for the cool graphic design of home energy upgrades!
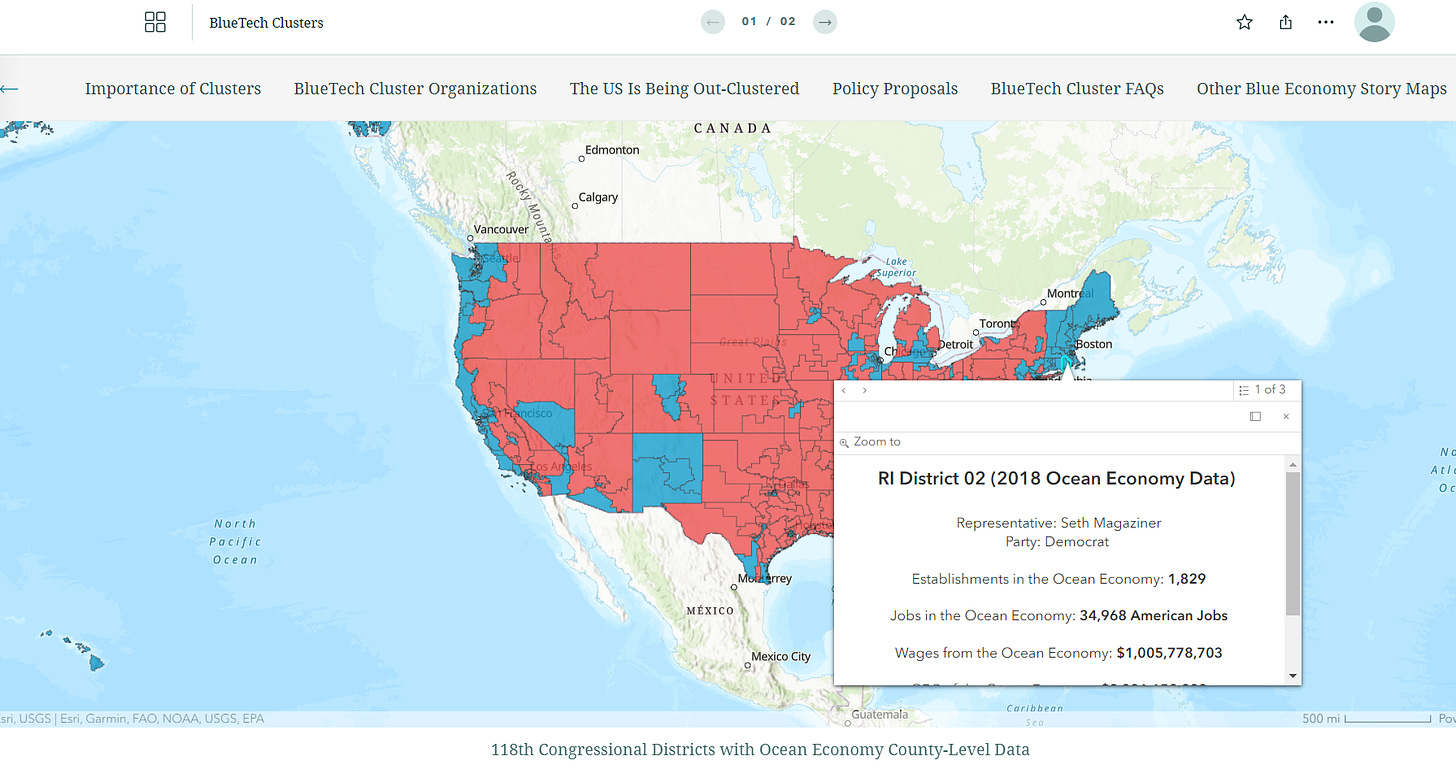
Updating the Blue Tech Clusters of America Story Map
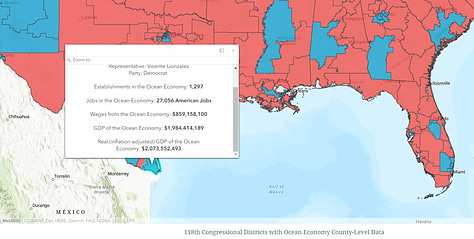
In early 2023, I conducted a data update for the Blue Tech Clusters of America Story Map1, which I’d previously created in 2021 with SustainaMetrix for The Ocean Foundation as a data-rich presentation to support their efforts to convince the U.S. Congress to provide more support to ocean science R&D. Among other changes, one of the major maps showed “the Ocean Economy” as it overlapped with each U.S. Congressional District, and since 2021 congressional district boundary lines had changed, so I remade the map with the 2023 congressional district boundary lines.
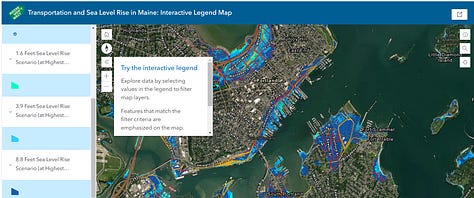
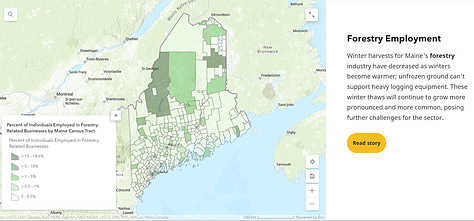
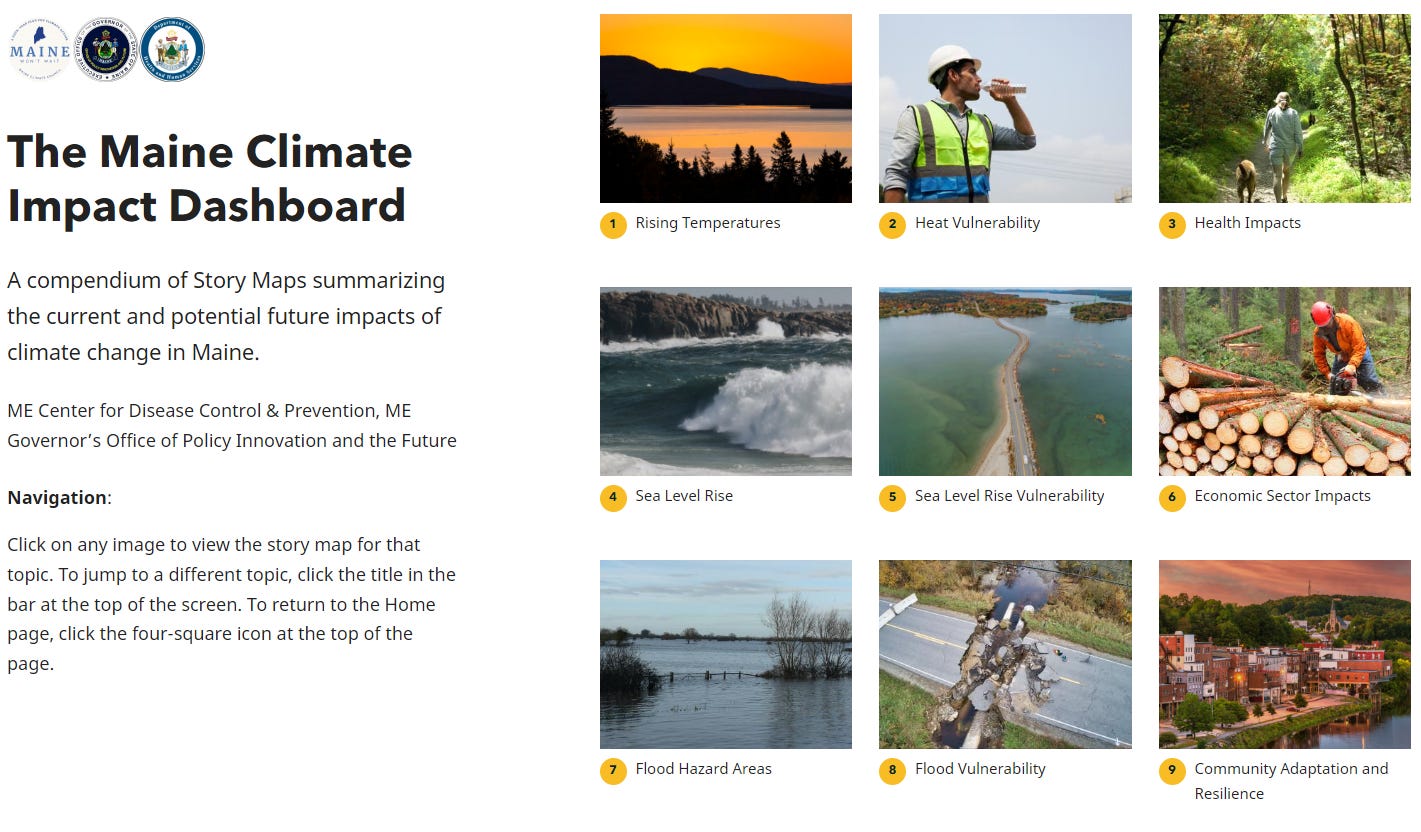
The Maine Climate Impacts Dashboard
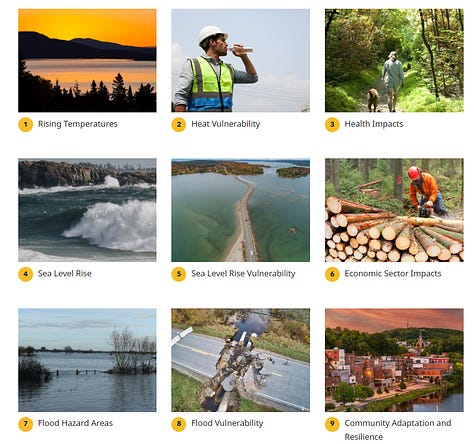
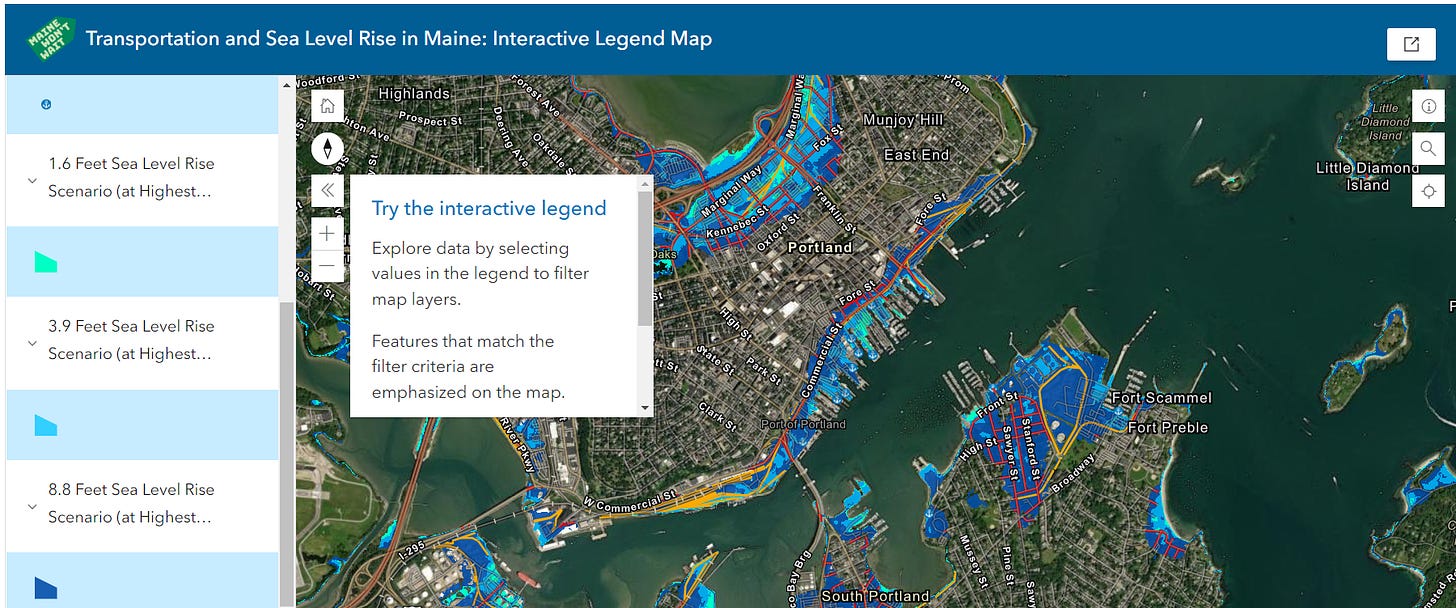
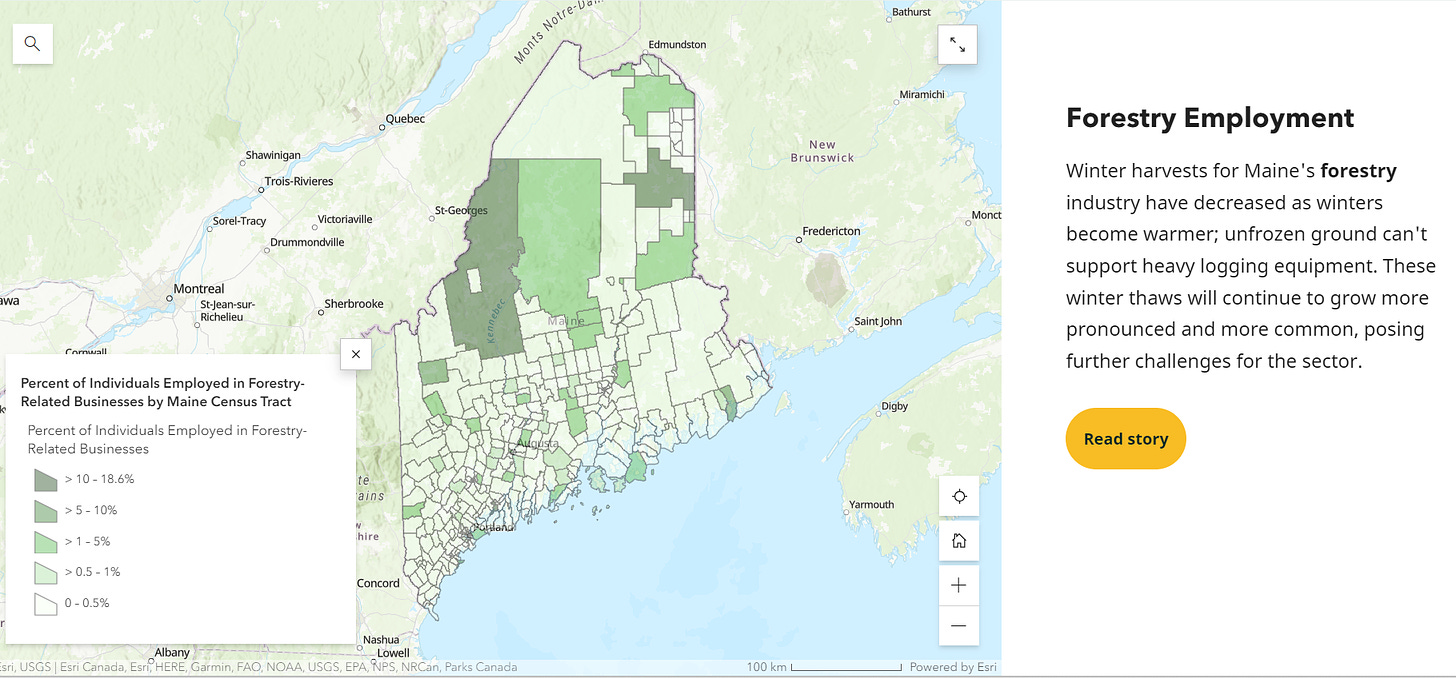
I really enjoyed working with the Maine CDC and Maine Governor’s Office of Policy Innovation and the Future to create the first-ever Maine Climate Impact Dashboard, a compendium of maps and data visualizations detailing current and potential future impacts of climate change in Maine.
There was a lot of excellent preexisting geospatial data available to work with, like NOAA’s sea level rise scenario map layers, and employment data by industry and census tract.
Here’s the Maine state page where the dashboard is embedded, and here’s the dashboard itself.
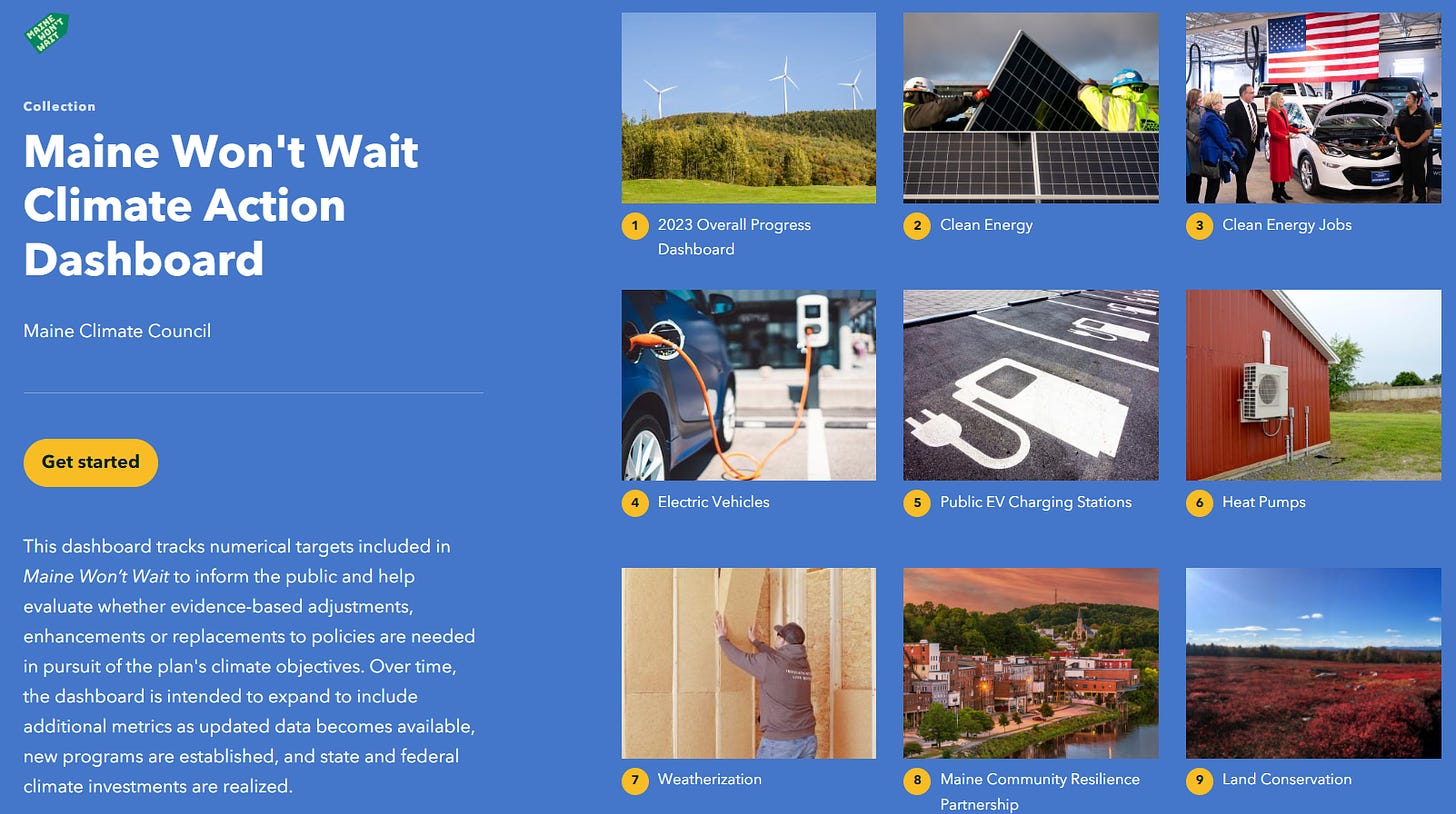
The Maine Climate Action Dashboard
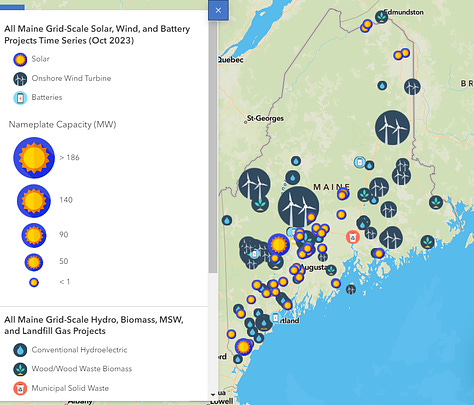
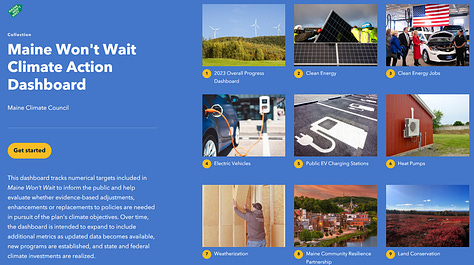
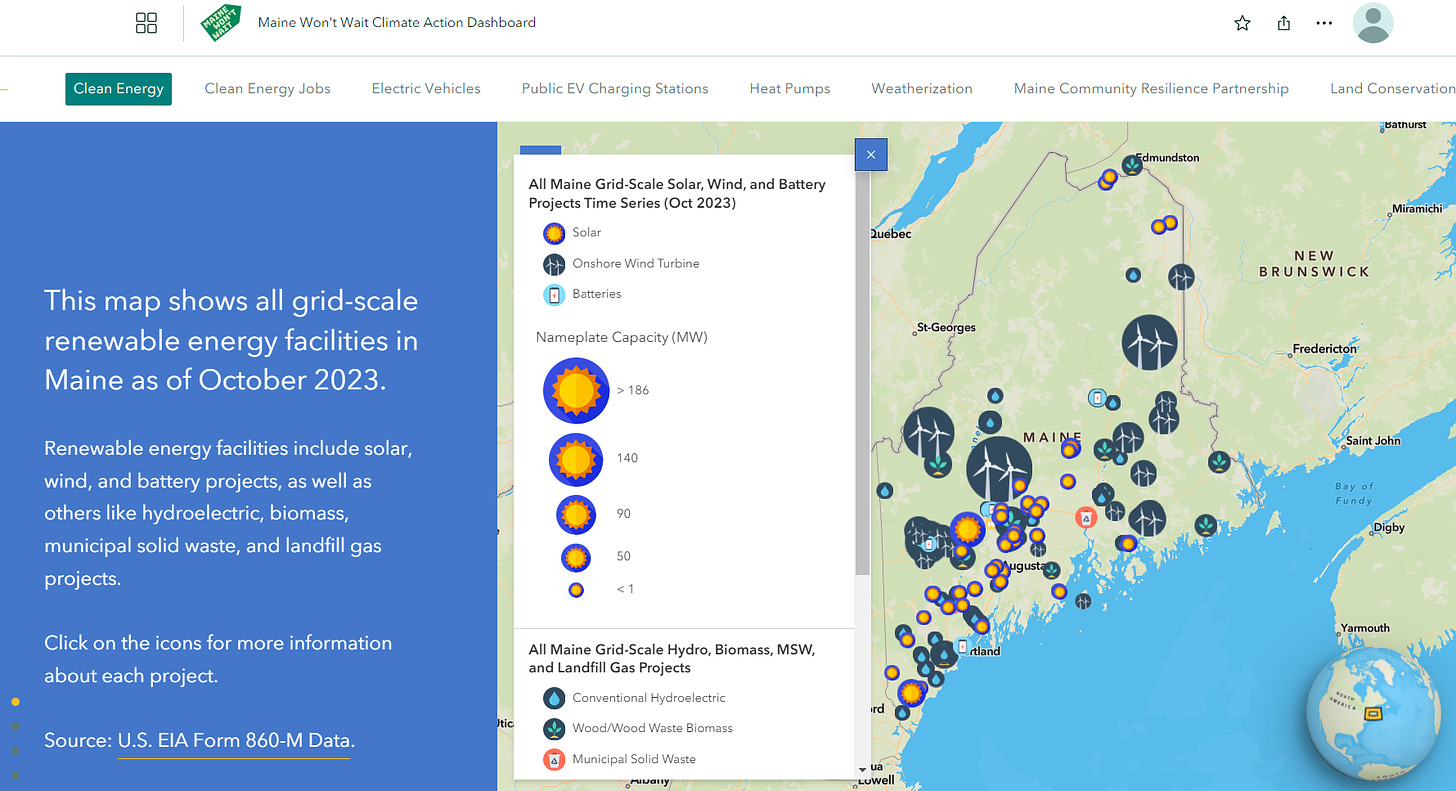
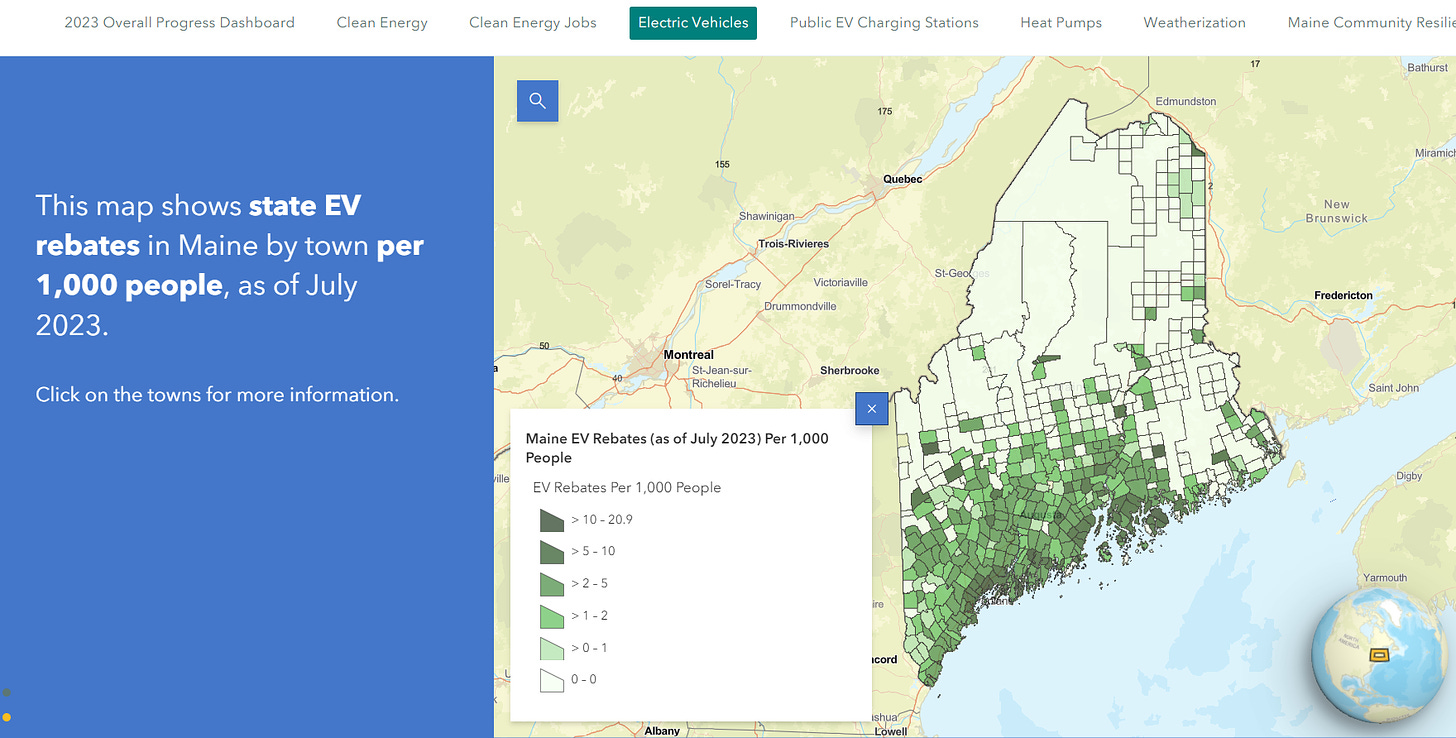
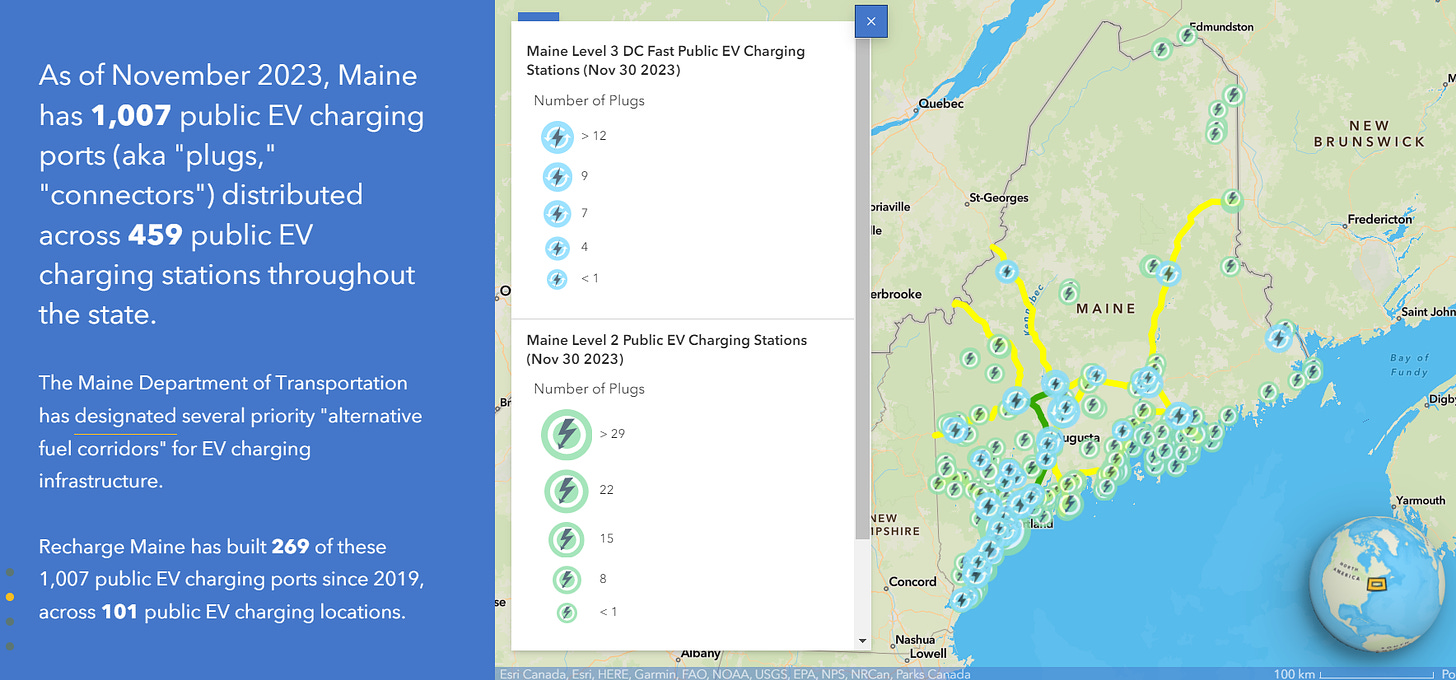
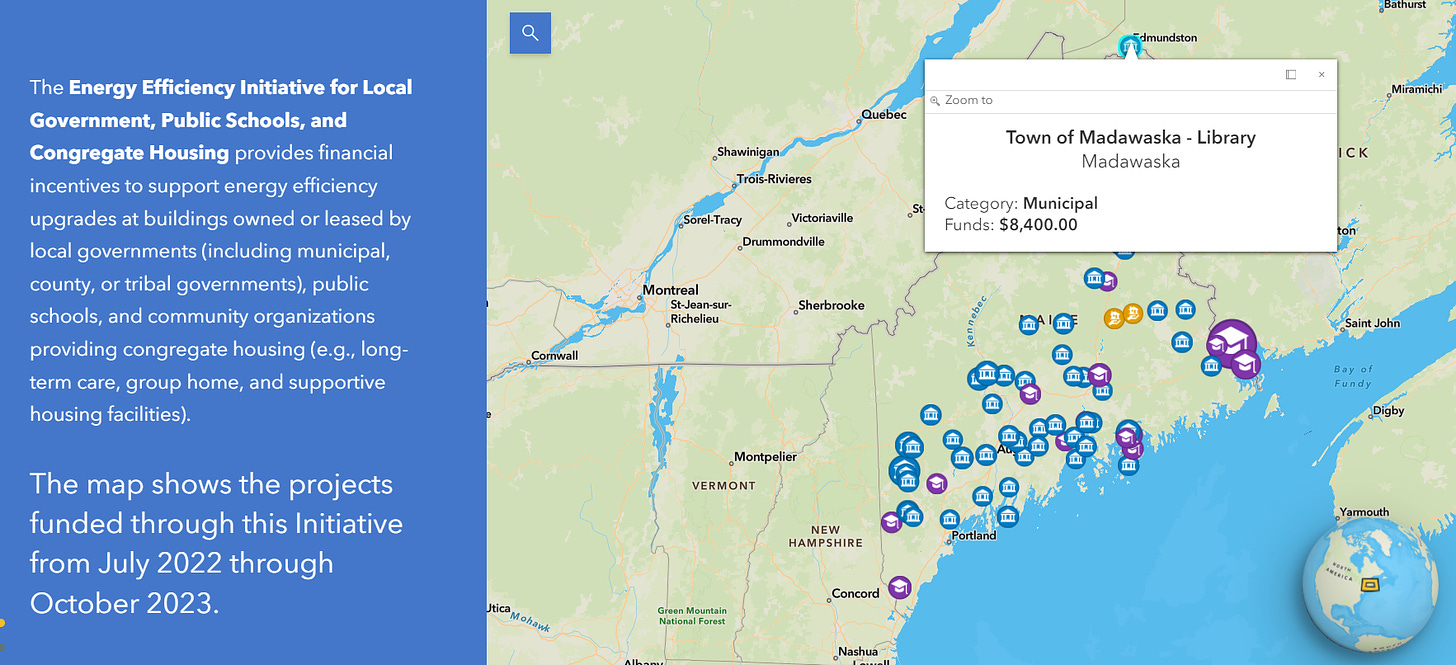
Probably my most involved GIS project this year has been the Maine Climate Action Dashboard.
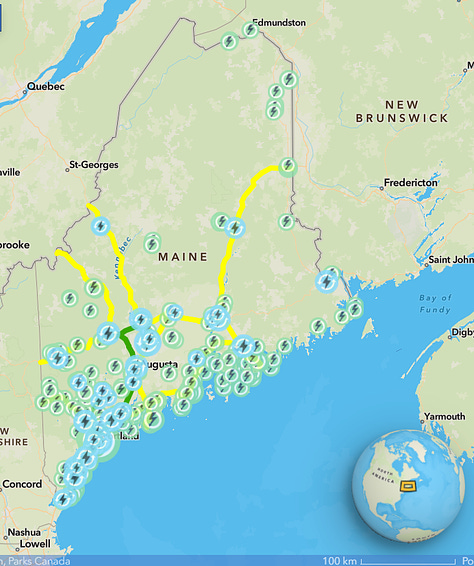
This dashboard tracks numerical targets included in Maine Won’t Wait (the Maine state climate plan) to inform the public and help evaluate whether evidence-based adjustments, enhancements or replacements to policies are needed in pursuit of the plan's climate objectives. Over time, the dashboard is intended to expand to include additional metrics as updated data becomes available, new programs are established, and state and federal climate investments are realized.
It includes a whole bunch of awesome maps and data visualizations!
Like most of my maps, the majority of the maps in this dashboard are clickable for more information: if you select a specific town or county or icon or whatever’s the focus of the map, you get a pop-up with details about it. This is a great way to make a lot of data publicly available, but in a format more friendly and interactive than a spreadsheet that lets people easily find and click on their points of interest.
Here’s the Maine state page where the dashboard is available, and here’s the dashboard itself.
Any of this look like the kind of thing that might be useful to you or your business/organization?
If you'd like a map like this made to showcase your own career, travels, and accomplishments (or a more specific map focusing on a current project) email me at samuelmatey@g.ucla.edu! I have a lot planned for 2024, so I can’t promise I’ll be available, but I’m open to potential new clients!
Cited on the MIST Cluster homepage.



These are beautiful maps! I love how easy they are to understand. You do great work, Sam.
These interactive maps are terrific! Nice work. On the energy map, I realize biomass and waste to energy are considered by many to be “renewable”, but they certainly aren’t zero carbon. Hopefully Maine and other states start excluding these sources from their clean energy goals as solar and wind proliferate. Yes, I know we currently need to mine for the materials to make solar panels and wind turbines, but compared to burning fossil fuels it’s a big win. https://www.sustainabilitybynumbers.com/p/energy-transition-materials