


The Weekly Anthropocene Interviews: Dr. Christopher Anderson, Forestry Satellite Data Analyst
A Scientist Spotlight Interview

A version of this article was previously published by The Weekly Anthropocene in May 2022, before the move to Substack. Here, it’s updated with more graphics and links!
Dr. Christopher Anderson is an environmental data scientist who has conducted extensive research with satellite imagery. Dr. Anderson is currently a researcher at Stanford University's Center for Conservation Biology. He is also the cofounder, CTO, and "resident expert in biodiversity mapping, plant ecophysiology, and satellite image analysis" of Salo Sciences, a conservation technology company. Dr. Anderson's personal website is at earth-chris.github.io, his Google Scholar page is here, and Salo Sciences' website is at salo.ai.
A lightly edited transcript of this exclusive interview follows. This writer’s questions and remarks are in bold, Dr. Anderson's responses are in regular type. Bold italics are clarifications and extra information added after the interview.
Hi, Dr. Anderson! It’s an honor to speak with you. I have many questions, but first, can you tell our readers a bit more about yourself? Why did you choose to become an environmental data scientist, and why specifically focusing on the mapping and satellite image analysis track?
Well, I think a lot of it came about from my experience learning to love ecology as a science. I grew up in the redwoods and that was always a sort of key part of my identity as a person. But it wasn’t until process of elimination as an undergraduate that I came to ecology as a discipline. I always liked mathematics and science, and that put me into the biology track. It wasn’t until I was taking courses in ecology and physiology that I came to appreciate the beauty and the profundity of the natural environment. It actually took me the experience of failing my plant physiology class as an undergrad to kick me into high gear, that was the only course I ever failed. What made [ecology] really compelling was that it was something I could see in my own daily lived experience. I was an undergraduate at UC Santa Cruz, which is just a beautiful campus and a great place to get excited about ecology and about the dynamics of earth's ecosystems. So it was just able to reinforce a lot of the things that I was learning, and thinking about it just became a real holistic part of how I understood the world, and that was really exciting to me.
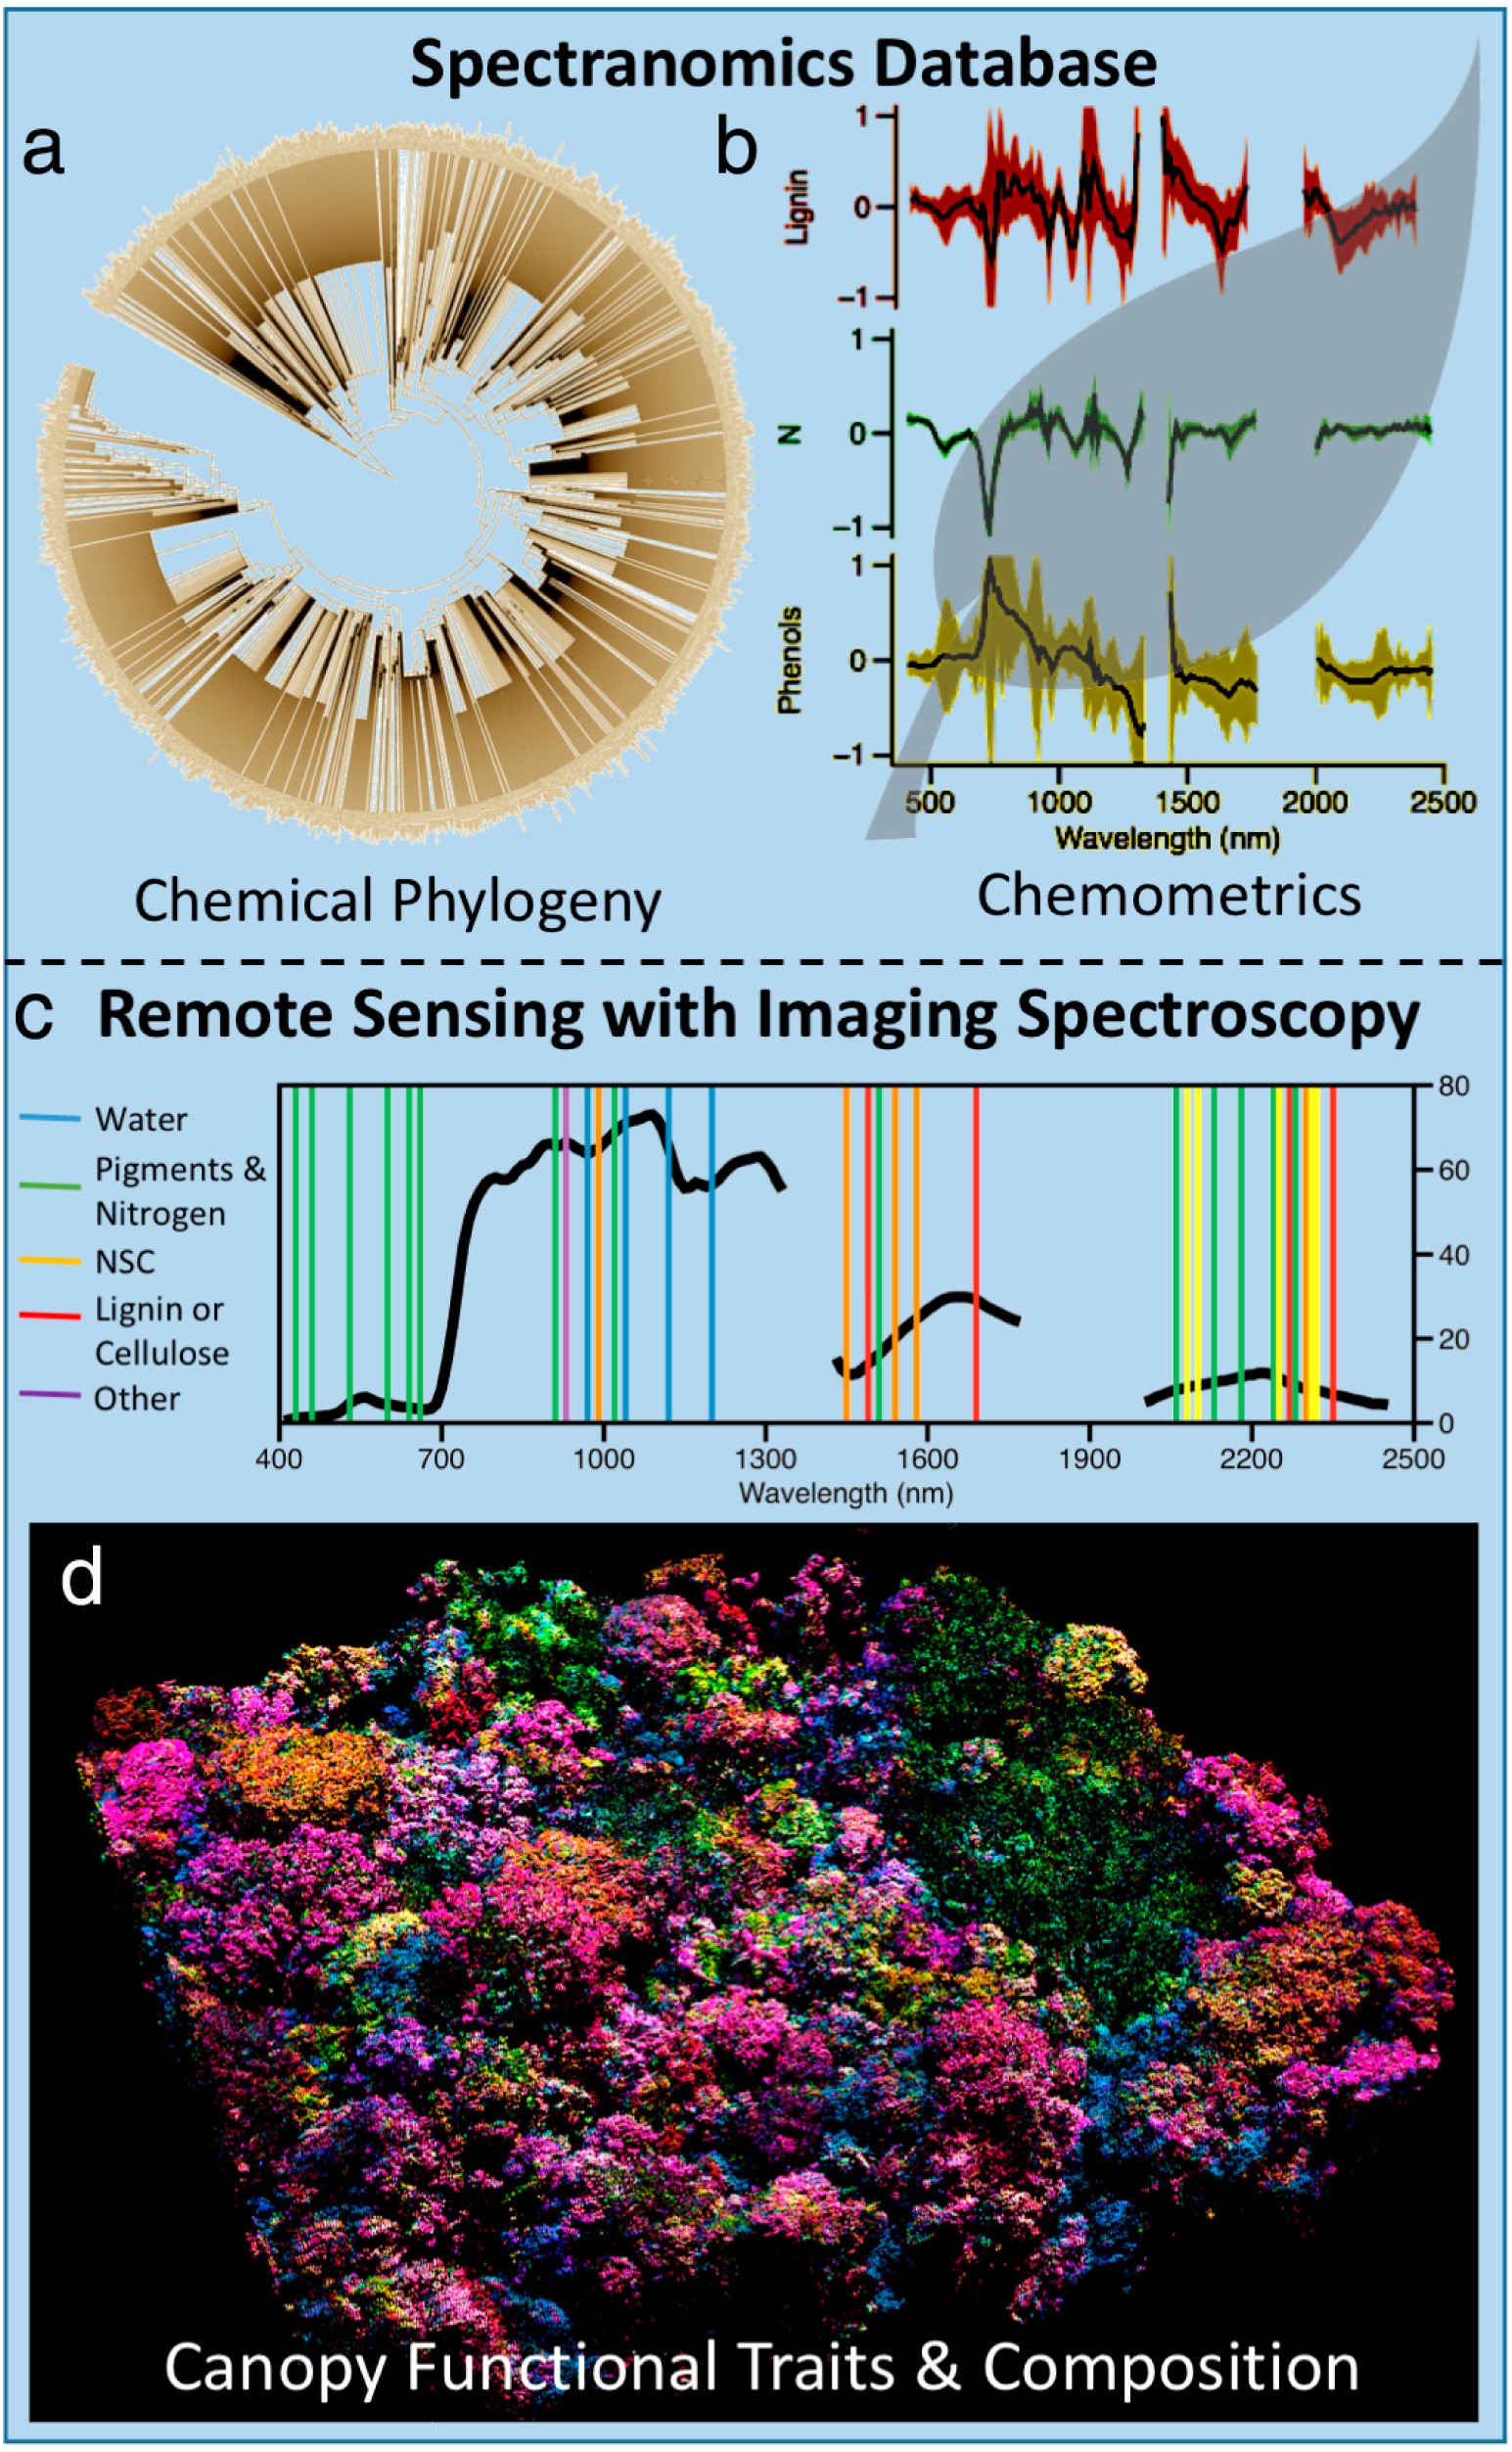
It wasn’t until a couple years after I graduated where I got a job at the Carnegie Institution for Science. I had a friend there who was working on a research project called Spectranomics, looking at the relationship between leaf chemistry, leaf structure, and how you would measure that from satellites. (Pictured: graphic from full paper on spectranomics). And so what they were doing is they were traveling to tropical forests all around the world, climbing to the top of trees, bringing down branches, stripping the leaves off, cleaning them, putting some in the oven to dry them, and grind them up taking some samples. Then freezing them like with liquid nitrogen and sending all that stuff back to the lab. (See more on this here). Our job was to then run a series of chemical analyses to understand things like defense compound concentrations, leaf nutrient concentrations, growth compounds, leaf structure, all that kind of stuff. I was offered that position because I had a strong background in leaf biochemistry. When they were telling me about the project, it was like “Oh yeah actually we're flying airplanes with lasers on them. And we're shooting them to trees and we're measuring the amount of light that's absorbed and reflected by plants and measuring how much nitrogen is in the tree from airplanes.” And I went, “What are you talking about, that's crazy!” Like, that's so cool! I didn’t know any of this technology existed until I was exposed to it by happenstance.
“When they were telling me about the project, it was like ‘Oh yeah actually we're flying airplanes with lasers on them. And we're shooting them to trees and we're measuring the amount of light that's absorbed and reflected by plants and measuring how much nitrogen is in the tree from airplanes.’ And I went, ‘What are you talking about, that's crazy!’ Like, that's so cool! I didn’t know any of this technology existed until I was exposed to it by happenstance.”
-Dr. Christopher Anderson
I was paid 10 bucks an hour at first, eventually 15 bucks, and then I worked hard enough in the leaf chemistry analysis that as they were growing the program for the airborne data collection, they needed people to come on and do some of the actually flying on the airplanes to collect the data, and process it downstream afterwards. And I just got lucky, they liked the work that I was doing. I was willing to put in the effort and during nights and on the train was commuting down to Stanford I was just reading papers on how remote sensing works. It was really, for me, learning on the job. And being so lucky to get the opportunity to do crazy cool things and start getting my hands on the data, to say nothing at how cool it was to fly airplanes around the world shooting lasers at trees.
How did you get involved with cofounding Salo Sciences, and can you tell our readers exactly what that company does?
Salo Sciences is a climate technology company. The simplest description is. we are very good at analyzing pictures of trees taken from space.
“The simplest description is. we are very good at analyzing pictures of trees taken from space.”
-Dr. Christopher Anderson
One of the motives for founding a company was that we saw that there is this incredible technology [remote sensing] that is being used, often in sort of academic and research context, to be able to answer questions like: How is biodiversity changing or distributed across large spatial scales? How are carbon stocks changing in response to disturbance and wildfire, how can we map them across large areas. But it seemed like a lot of this was-it’s not a particularly original critique-often funded for the purpose of research, a few people get the benefits of understanding how to work with the information and publish the results, and then it will kind of sit there in a database or be published as a paper. And we decided that there were lot of opportunities to use this information and this technology to help inform a lot of the large-scale conservation challenges around the world.
So we wanted to build something, from the ground up. Our own version of NASA, for mapping the earth, really focused on trees, carbon, biodiversity, and how they change. I would’ve worked for a global organization doing it if one existed.
“We wanted to build something, from the ground up. Our own version of NASA, for mapping the earth, really focused on trees, carbon, biodiversity, and how they change. I would’ve worked for a global organization doing it if one existed.”
-Dr. Christopher Anderson
You’d think it would be a global governance system, but it doesn’t really exist. We did what most people do when the thing they want doesn’t exist, we had to create it ourselves. So that was how we set out to build Salo to be the premier forest monitoring technology company. And it's taken a long time to build it from scratch and to do that, from the perspective of being a private organization as opposed to a public institution. We don’t take outside investment, because that would be viewed as swaying our neutrality as an organization. We've tried to really build the organization from the ground up and bootstrap it based on the needs and demands of the people who need the products that we create.
That’s really inspiring, an incredible vision.
You coauthored a very interesting paper a few years back, “Tree species abundance predictions in a tropical agricultural landscape with a supervised classification model and imbalanced data.” I’ve done some supervised classifications myself-can you tell me more about your process here and your results for the Panamanian landscape you analyzed?
A lot of that was led by Sara Graves, a Ph.D. student at the University of Florida, now at the University of Wisconsin as a professor. At the time there was a lot of effort into developing novel species classification algorithms. Understanding the spatial distribution and tree species is really important for a lot of different applications, like the rate at which they accumulate carbon, how they support wildlife, just for the value of the information. The airborne imaging spectroscopy data is one of the best resources for mapping tree species, as a remote sensing resource. These datasets measure the light reflected by vegetation, from the visible spectrum further into the infrared spectrum. And that’s really valuable information. Say you have two different tree species, one [has leaves that are] really bright green, one is really dark green. The really dark green species is absorbing a lot more red and blue light, the bright green is reflecting a lot more light. Ultimately, that’s a function of the amount of chlorophyll that’s in each tree. More chlorophyll, darker green trees. And as you move further into the spectrum into the near infrared, shortwave infrared, there are other things like how much nitrogen there is, how much cellulose they have, how many leaves are on the tree, the total water content, this is all information that you can derive from that spectroscopy signal. What makes this really critical is that different species have different underlying chemical fingerprints; there's a consistent chlorophyll distribution, consistent nitrogen use, consistent water content within trees of the same species. So put those things together, and you can use that information in the spectral signal to discriminate between different tree species.
“Different species have different underlying chemical fingerprints; there's a consistent chlorophyll distribution, consistent nitrogen use, consistent water content within trees of the same species. So put those things together, and you can use that information in the spectral signal to discriminate between different tree species.”
-Dr. Christopher Anderson

(Pictured above: graphical abstract of paper). And so, one of the big challenges is being able to get enough data to make enough observations on the ground to correctly say that we have this many species, here's the sort of representative fingerprint of the data sets that they occupy and how we can try to scale out over large areas. One problem that you run into in data science that's really common is the issue of imbalanced data. Having some class really well represented, other classes really poorly represented. This is fairly classical in ecology, because there are all sorts of exponential distributions where you tend to have species that are very common and species that are very rare. So, how would you come up with a data science based approach to address some of that imbalance, where you have some species with a lot of information and some species with very little information? That was the goal of the paper, to try to think about how you might understand these data sets and how you might choose the algorithm that you use to parse through that data to handle some of those different challenges. And then what you can get as a result is a map of tree species across agricultural landscapes, which helps predict carbon storage on them and the wildlife available in those areas.
Can you tell me more about your and Salo Sciences' current California Forest Observatory project? What’s it like working with Planet and their cubesats? How are you planning to work with communities to make this data useful? What languages and platforms are you coding in-JavaScript, QGIS, Leaflet?
The Forest Observatory product itself is really three primary components. The first is the underlying datasets themselves. This information is 3 meter spatial scale, which is accessible through our partnership with Planet. And these are maps of the patterns of forest structure that drive wildfire behavior. So things like, how tall the tree is, what is the density of ladder fuels-which is the vegetation that's on the floor of the canopy and could lead to surface fire transitioning into a canopy fire-as well as the distance between the forest floor and the lowest layers in the canopy. And then also a surface field model that predicts things like spread rate and how tall flames could be, and maps that across the whole state. It’s updated on a regular basis using satellites.
Second component of it is an API (application programming interface), which I didn’t really know what it was until I had to build one myself. I think that's more or less the lesson of all the stuff that we do, it's really just about being curious and capable about learning new technologies as they come up. The API is a way to allow command-line or programmatic access to the datasets we have. Instead of downloading a 10-gigabyte GeoTIFF (big map image), you can just say, “Oh, I need to run zonal statistics in this area, can I get the value for this latitude and longitude? Can I actually just show the web map tiles, display this on a web map?” So the API is the way you can do that and get more fine-grained control over the datasets.

Third component is the user interface, forestobservatory.com. (Available to all at forestobservatory.com, pictured above).The goal for that was to provide good visual access so that people were able to understand the datasets, to visualize how the patterns of forest structure change over space and how they interact with the other drivers of wildfire behavior. We decided there was a really good opportunity to create more or less Google Maps for wildfire risk. You can just look at something and it will tell you here's where I am, here's the fuels around the landscape, here's what fire parameters are and here's where the wind speeds are blowing. There are lot of choices there you have to make, in terms of what sort of information you represent, how you represent it.
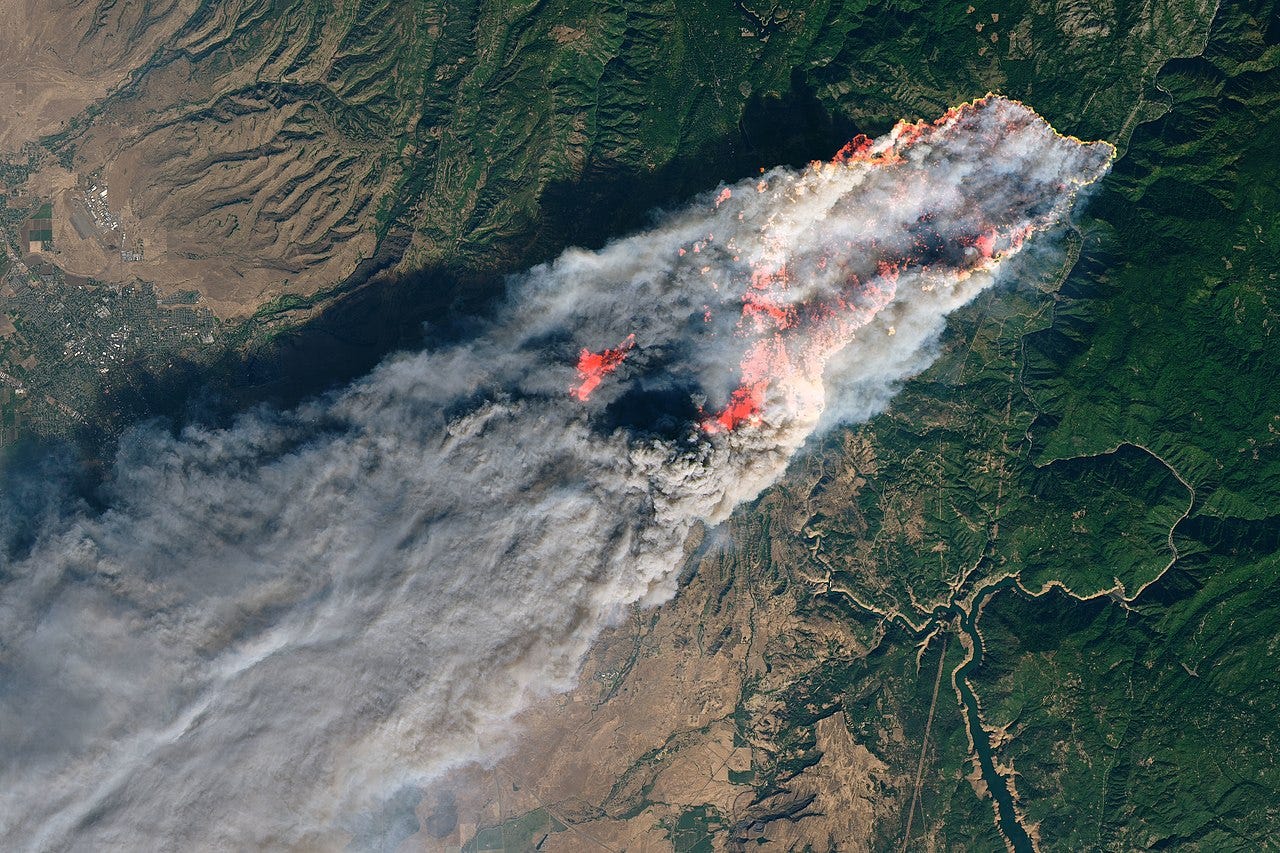
It came together in partnership with Planet (pioneering private satellite company Planet Labs), because after the Camp Fire in 2018 (the most expensive natural disaster in the world that year, killing at least 85 people and destroying at least 18,000 structures) and the major destruction and devastation of the past couple of wildfire seasons, everyone was like “Holy shit, this is an all hands on deck moment.” We need to be able to bring all this technology together. We need to improve our resilience and to improve our understanding of these dynamics and help us be better prepared for the future. And there are very good opportunities for better data to help us do that.
That's obviously not the whole story, but it came together. It was supportive. We were leading a lot of the technical development, Vibrant Planet (a different company from Planet Labs) was doing a lot of outreach.
And part of why their involvement was so critical is that we needed to do interviews with a series of stakeholders in wildfire science. New data products can come and go all the time, but people need to know: does this data solve my problem? Is it designed in a way that I can access it? Does it tell me what I need to know? Do I trust these people? We just had to work through a long process of interviewing 70 people to figure out what the data needs were. How they would use it, how we should present it, timescales and all that sort of stuff. So that was how we built the system, and since then we've been working on expanding the geographic coverage. We started in California as pilot. And we are expanding this summer to all of the Mountain West, this is eleven states of Colorado and points west. And we’ve been doing some work in Australia as well, learning about new fire models Down Under.
What major software and programming language are you using and what skills are you looking for at Salo Sciences right now?
We mostly do a lot of work in Python for our software development, and all of our computing resources are built on top of Google Cloud. That’s the alternative to AWS; Google Cloud platform has a series of cloud storage features, so you can host data in public buckets and access it in cloud native data formats.
Otherwise we mostly built everything as a custom software system, using TensorFlow, rasterio and gdal. Geopandas is great, that’s super cool. The thing we experience in geospatial is that every problem is a custom problem, it’s hard to build things that are one size fits all. There are some particular dynamics to geospatial data, where there are a lot of deep learning packages in TensorFlow for doing image recognition, but they’re all based on RGB data, like maybe three channels of information. And a lot of stuff is hard coded for how you would do image sampling and resizing. And you don’t want to mess with that, different things emerge if you resample ecological data or remote sensing data, so we’ve built our own custom in-house software systems to be able to work with a lot of that information. We’re kind of remote sensing generalists, we work with hyperspectral data, LIDAR, JEDI, with field data. So being confident in a lot of different technologies and knowing some of the advantages and disadvantages of them in ways to pull them together, that's sort of the bread and butter.
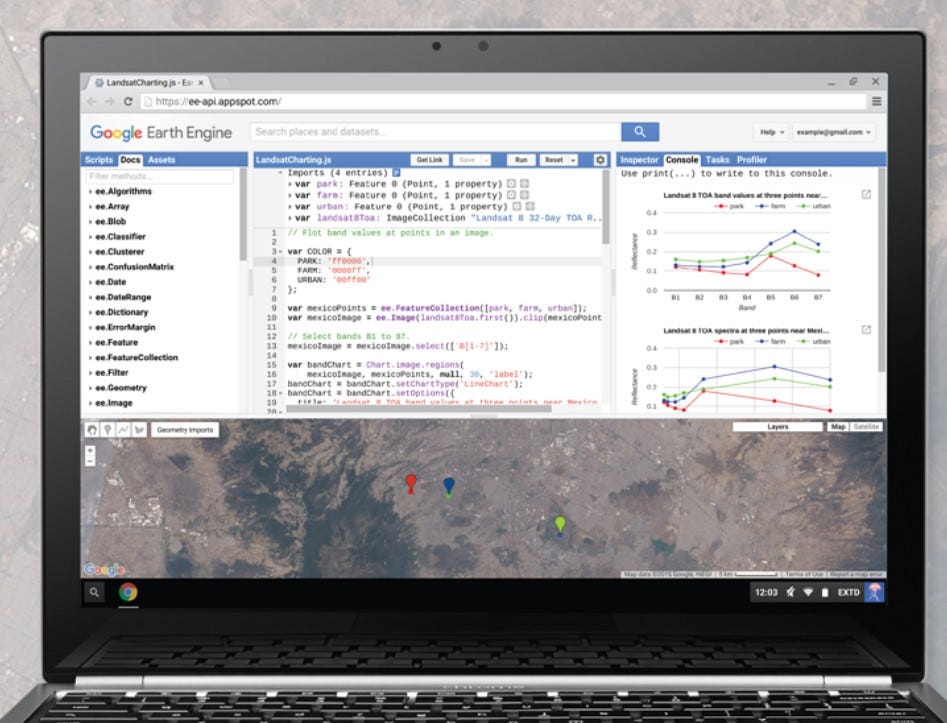
We’ve grown relatively slowly, but we are intentional with the people that come on board. Being willing to learn new technologies and having a good enough grasp to get started tends to work pretty well. We’re becoming a bit more specialized now as we are developing more specific data products, but that's been sort of our set priorities. Nobody has Google Cloud experience, everyone comes from AWS, so that's often a learning experience for people, but you know we love [Google] Earth Engine. (This writer loves Earth Engine too and has used it a lot in recent years-it's a really cool, mostly free, global satellite imagery platform). Earth Engine is amazing. It was such a revelation when it first arrived, we’re huge fans of Earth Engine, but commercial support is limited, and we spent so much time poking at the individual pixels in our datasets that we need to be operating at that really low level. And Earth Engine requires a lot of abstractions to be able to understand the data sets so that hasn’t been our priority for building out sort of scalable solutions, yet.
Thank you so much for sharing your wisdom today!